[View]  [Edit]  [Lock]  [References]  [Attachments]  [History]  [Home]  [Changes]  [Search]  [Help] 

[UI8]UI8Debugger

Uploaded Image: idea.gif
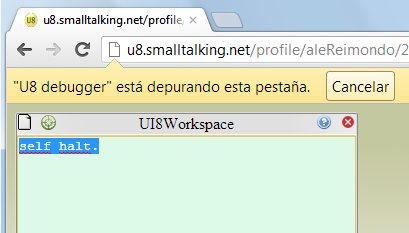
If you do not need debugging at native level, you can use [UI8] UI8Steps to debug S8 expressions
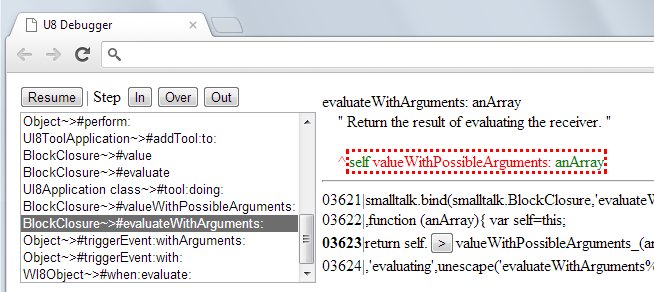
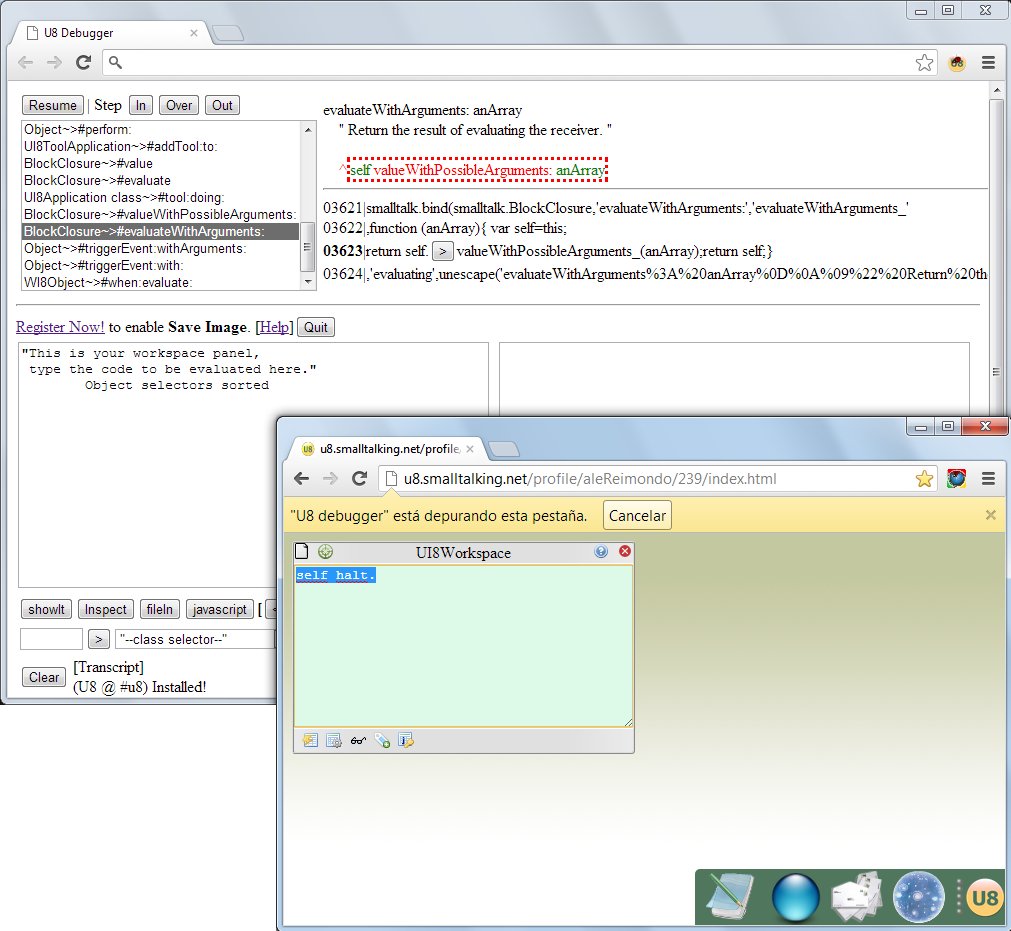
Native debugger

An efficient debug instrumentation has been implemented for S8, using Google's Chrome debug API.

The debugger is implemented to enable debugging a running system (s8 and/or javascript) from another S8 system running as a Chrome extension.

NoteThe debugger is implemented in S8, as a Chrome extension application.
Uploaded Image: alert.gifAlso note that pictures can defer from current UI, because the U8Debugger is enhanced each time we have an opportunity to work on it


The U8 debugger can debug a remote system

The U8 debugger is published as a contribution and can be downloaded from this page.
To install the debugger, you must point your Internet browser to the contribution page and follow the installation steps.

After installation you can open a web page and debug the system running in the page. If the system is running a S8 environment, the debugger will show debug interface at Smalltalk level; in cases of the page do not use S8, it will be debugged at javascript level.

To debug a S8 system running in a web page, you should open the page and press the U8Debugger button, at right of the address box of your Chrome browser.
Uploaded Image: U8DebugIcon.jpg

After you press the debug button, a new tab page (the U8 debugger tab) will open with the U8Debugger interface.
The page been debugged will show a banner at top of the page saying that it is under debugging (you can cancel debugging pressing the cancel button in the banner).
Uploaded Image: selfHalt.jpg

When a S8 system is been debugged, any "halt" message is resolved pausing the system and entering debugger state (if a debugger is not present #halt messages are ignored).
The U8 debugger tab will change contents when the debugge is paused. The page will show call frames of the paused system, and at this point you can debug/browse/change the system under debugging from the U8 debugger page.
Uploaded Image: callFrame.jpg

The U8 Debugger GUI is compact using basic U8 widgets, to enable debugging from remote systems (e.g. phones :-) ) We will publish debugger tool based on WI8/UI8 widgets.
Actually the debug GUI is under development and will change to support:
A snapshot of a debug session follows, showing the point of execution (smalltalk code) when paused.
Uploaded Image: U8Debug.jpg

Try the U8 debugger! it is easy to install and will show you how easy is to debug a S8 system from another S8 system!
All debug actions can be executed from remote S8 system and debugging experience can be automated from another S8 system running remotely.
Our debugger instrumentation open new ways of doing smalltalk.

Now, your (S8) Smalltalk systems can be assisted from other S8 systems connected by remote debugging channels! Have fun!

References


NTH & feature requests